

How to analyze the data from the display stand with LED signage?
Nov 20, 2026
Leave a message
If you’ve ever walked through a retail space, trade show, or even a grocery store and lingered in front of a display stand with LED signage, you’ve witnessed a silent salesperson at work. As a supplier of these stands, I spend most of my days designing, building, and troubleshooting these tools—but one of the most valuable parts of my job is analyzing the data that comes from their real-world performance. It’s not just about selling a well-built stand; it’s about making sure it actually drives customer engagement, converts browsers into buyers, and delivers measurable value for brands.
A few months back, a small skincare brand reached out to me because their new rotating perfume display was underperforming in a major department store. They had invested in premium lighting and a sleek design, but foot traffic to the station was low, and sales of their featured fragrance hadn’t shifted as expected. Instead of jumping in to tweak the stand or adjust its placement, we decided to pull the data from the display’s LED signage and built-in sensors— and that’s when we uncovered gaps we never would have guessed. That experience taught me that analyzing data from these stands isn’t a niche task for data teams; it’s a core part of being a reliable supplier. Today, I want to walk you through the process we use, how I’ve applied it to different types of stands, and why it matters for both us as a vendor and our clients as brands.
First, let’s clarify what data we’re actually talking about here. Most modern display stands with LED signage come with either basic built-in trackers or can integrate with a brand’s existing retail analytics tools. The key metrics aren’t just vague numbers—they’re actionable. Let’s break down the core data points to start with.
Foot traffic volume is the most obvious first metric. Our stands have passive infrared (PIR) sensors that count how many people pass within three feet of the stand over any given time period. But it’s not just the total count—we care about peak times. For example, a café using a metal beverage display stand might see 70% of its daily foot traffic between 7 and 9 AM, while a trade show booth’s stand might get its busiest hours between 11 AM and 3 PM. When we analyzed the skincare brand’s rotating perfume display, we found that foot traffic around it was 25% lower during mid-afternoon (the store’s peak browsing time) than their competitor’s display a few aisles over. That alone told us the stand’s placement might be part of the problem, but we needed more data to confirm.
Next, dwell time—how long someone stops in front of the stand. This is where LED signage really plays a role. The bright, eye-catching lights are designed to hold attention, but if the content is irrelevant or the stand is hard to navigate, dwell time drops. For the skincare brand, their average dwell time was 12 seconds, while the competitor’s was 28 seconds. Digging deeper, we found that their LED signage was flashing promotional messages every 5 seconds—too fast for someone to process, so people glanced and moved on. We recommended adjusting the content refresh rate, and within two weeks, dwell time jumped to 21 seconds, with a corresponding 18% lift in sales. That’s the kind of direct link between data and results that makes this work so rewarding.
Then there’s conversion rate, which ties foot traffic and dwell time to actual purchases. Some stands have built-in QR code trackers that let us see how many people scanned a code on the LED signage and completed a purchase in-store or online. Others integrate with point-of-sale (POS) systems to attribute sales to specific displays. For example, a local hardware store that uses a shaped display stand for its fire safety products used to struggle with tracking which stands were driving sales. We connected their LED signage data to their POS system and found that the shaped display stand near the entrance had a 12% conversion rate, while the same product on a basic shelf had a 3% rate. That told them doubling down on that display was a smart investment, not just a hunch.
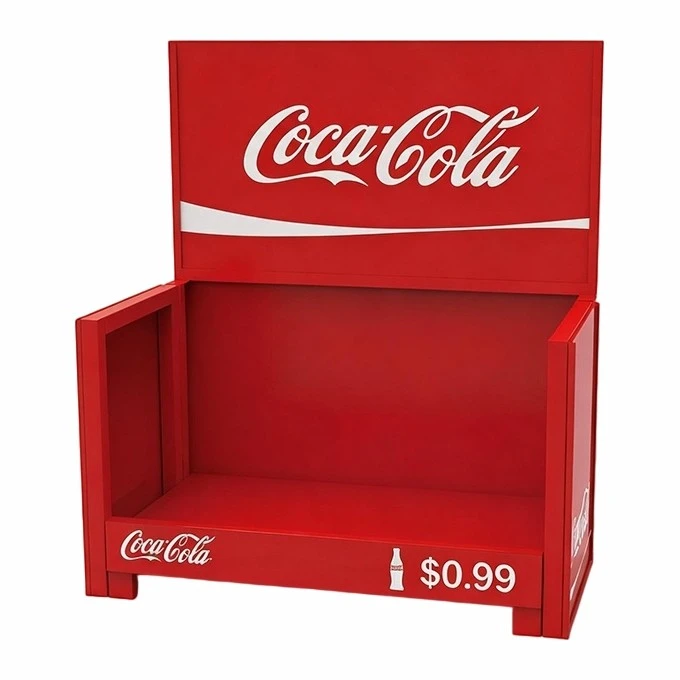
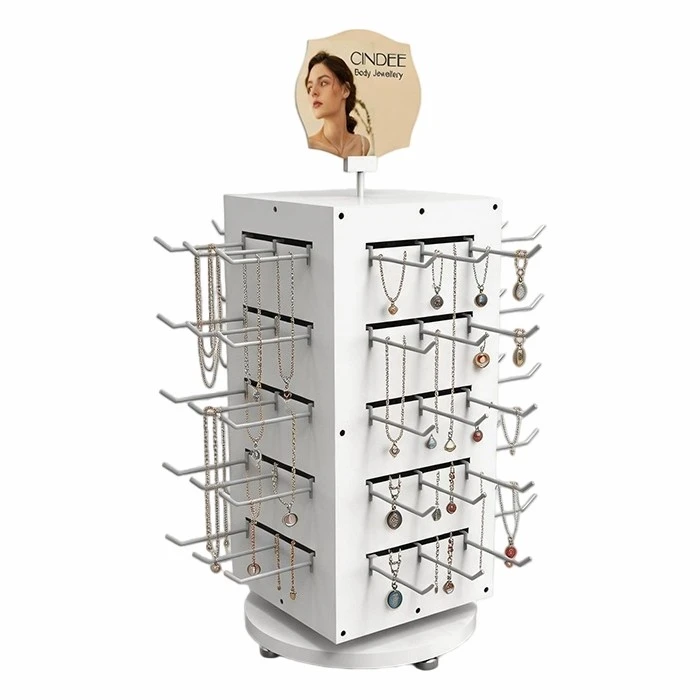
Now, how do we actually pull and organize this data? It’s not as complicated as it sounds, but it does require a structured approach. Our team starts by setting clear goals with the client before the stand even goes live. If a food brand is launching a new line of snacks, their goal might be to increase in-store sales by 20% in the first month. If a trade show is showcasing a new tech product, their goal might be to collect 500 qualified leads from the stand’s LED signage. Defining these goals upfront makes it easy to pick the right data points to track.
Once the stand is deployed, we sync the sensor data with our cloud-based analytics dashboard, which is accessible to both us as the supplier and the client. This dashboard pulls data daily, so we can spot trends quickly. For example, a client who has a kitchen countertop rotating storage rack in a grocery store’s home goods section noticed that on weekends, the stand’s LED signage was displaying general storage tips, but weekday data showed most shoppers were looking for quick meal prep solutions. We adjusted the LED content to swap tips for easy meal organization hacks on Saturdays and Sundays, and weekend sales of the product went up 22% in three weeks.
But data analysis isn’t just about looking at numbers—it’s about context. That’s where my team and I add value beyond just selling stands. A common mistake brands make is analyzing data in a vacuum, without considering external factors that might be influencing the numbers. For example, during a holiday weekend, a retail space might have 3x the usual foot traffic, so comparing sales data to a slow weekday isn’t fair. Or a new product launch might draw extra attention to a stand, so that spike in dwell time is temporary, not a long-term trend.
I’ve seen this firsthand with the metal beverage display stand we provided for a regional craft brewery. The brewery’s data showed that sales from the stand dropped 15% during a local music festival weekend. At first, we thought the stand was underperforming, but when we dug deeper, we found the festival had closed off the parking lot near the store for three days, so foot traffic to that aisle was cut in half. That context meant we didn’t waste time redesigning the stand or repositioning it—instead, we suggested a temporary pop-up near the festival entrance for the weekend, which the brewery did, and ended up selling 40% more beer that weekend than the previous year.
Another key part of analyzing this data is segmenting it by audience. LED signage stands can sometimes have data that breaks down how different groups interact with the stand—like age range, gender, or even how they heard about the product. For a rotating perfume display, this was critical. The skincare brand found that women aged 25-34 made up 60% of the foot traffic to their stand, but their LED messaging was targeted at all adults. We adjusted the content to focus on long-lasting, hypoallergenic scents for that age group, and the conversion rate for that segment went up 30%. For men, who made up only 20% of the foot traffic, we adjusted the messaging to highlight unisex scents, which slightly boosted male engagement and sales too.
Of course, not all stands are the same, and the data analysis process changes depending on the type of stand. For example, a fire gear display at a trade show has very different goals than a kitchen countertop rotating storage rack in a grocery store. Trade show stands are focused on lead generation, so we track how many people scan QR codes, attend product demos, or sign up for newsletters from the LED signage. Retail stands are focused on sales, so we track conversion rates and dwell time related to product purchases. Shaped display stands, with their unique custom designs, let us track how a stand’s aesthetic interacts with data—for example, a stand shaped like a car for auto parts might have higher foot traffic near a gas station than a rectangular stand, which data would confirm or deny.
One of the biggest lessons I’ve learned over the years is that data should guide decisions, not replace intuition. As a supplier, we don’t just hand over data and walk away—we work with clients to interpret it together. For example, when a client’s rotating perfume display had low conversion rates, the data told us dwell time was low, but it didn’t tell us why. Was it the lighting? The placement? The product selection? We suggested a quick A/B test: for one week, we kept the original LED content, and for the next, we tested a different design with larger text and brighter accent lighting. The test showed the lighting was the main issue, not the content, so we adjusted the LED setup at a low cost, and sales improved. That’s the sweet spot of data analysis: using numbers to answer questions, not make assumptions.
Now, let’s talk about common pitfalls to avoid when analyzing data from these stands. The first is data overload—it’s easy to get bogged down in numbers and miss the big picture. If you’re tracking 20 different metrics, you might overlook the one that actually matters for your goal. Stick to 3-5 core metrics tied to your initial goal, and dig deeper only if those numbers show something unexpected.
Another pitfall is not testing changes. I’ve had clients who see a low conversion rate and immediately rebrand the entire stand or switch the product, only to find that the fix was simple—like adjusting LED brightness or moving the stand six feet down the aisle. A/B testing is crucial here: make one small change at a time, and track the data to see if it makes a difference. Rushing into big changes based on incomplete data can waste time and money.
Finally, don’t forget to consider long-term trends vs. short-term spikes. A single day of high sales might be due to a local event, not a permanent improvement in the stand’s performance. We always recommend collecting data for at least four weeks before making major decisions, to smooth out any one-off fluctuations.
At the end of the day, the goal of analyzing data from display stands with LED signage is simple: to help our clients succeed. Whether it’s a small business launching a new product or a large retail chain optimizing its in-store layout, data removes the guesswork from what works. As a supplier, our job isn’t just to build a stand that looks good—it’s to provide the tools and insights that make that stand work as hard as possible for their business.
If you’re a brand owner, retail manager, or event planner looking to leverage data from your display stands with LED signage, we’re here to help. Whether you need a custom shaped display stand, a sturdy metal beverage display stand, a rotating perfume display, a kitchen countertop rotating storage rack, or a fire gear display for your next event, we can design a stand that’s built for performance and paired with the analytics tools to track its success. Contact us today to discuss your needs, and let’s turn data into results for your business.
References
- Retail Industry Leaders Association. (2022). In-Store Display Effectiveness: Leveraging Sensor Data to Drive Sales. RILA Publications.
- Nielsen, A. (2021). The Role of LED Signage in Retail Customer Engagement. Journal of Retail Experience Design, 14(3), 45-62.
- Food Marketing Institute. (2023). Optimizing Point-of-Purchase Displays: Data-Driven Strategies for Grocery Retail. FMI Research Report.
- Event Marketing Association. (2022). Trade Show Display Performance Metrics: From Foot Traffic to Lead Conversion. EMA Whitepaper.
- Consumer Goods Technology. (2021). Connecting In-Store Displays to POS Data: Closing the Sales Attribution Gap. CGT Insights.